Your All-in-One Dashboard Solution Awaits!

Hop onto all your apps and tools effortlessly from one convenient place.
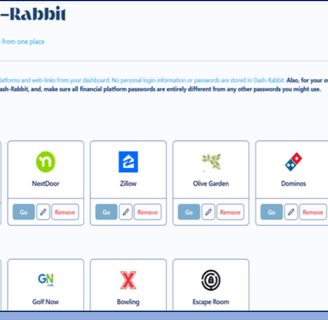
Dash-Rabbit

Dashboard Solutions

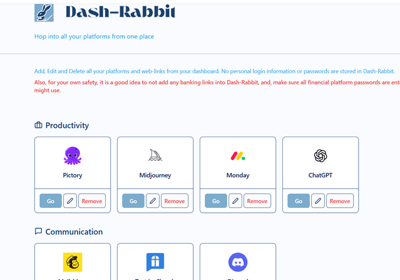
Access all your web-based tools effortlessly from one convenient location with our innovative dashboard.

User-Friendly Design

Enjoy a simple, fun interface that makes managing your apps and platforms a breeze.

A digital dashboard displays metrics related to web performance. Graphs show detailed statistics such as total clicks, total impressions, average click-through rate (CTR), and average position over time. The chart utilizes various colors to distinguish different data sets, and the interface features tabs labeled 'QUERIES', 'PAGES', 'COUNTRIES', 'DEVICES', and 'SEARCH APPEARANCE'.
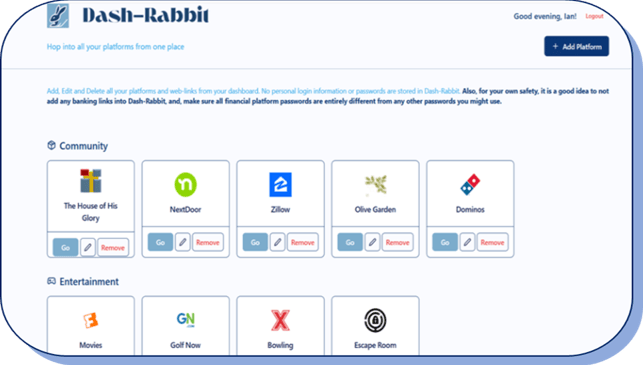
Customizable Categories

Rest assured knowing your data is protected while you enjoy seamless access to your platforms.

Easily navigate through your applications and tools, enhancing productivity and saving you valuable time.

Time-Saving Solution
A laptop with an open screen displaying dashboard analytics featuring charts, graphs, and numerical data related to sales and subscriptions. The interface is predominantly dark-themed with sections highlighting key performance metrics. The device shown is a MacBook Pro, indicated by the keyboard layout and branding.
A computer screen displaying a data analytics dashboard with graphs and charts. A blue line graph shows fluctuations in data over time, and a section highlights the number of page views. A pie chart is partially visible, indicating a breakdown of different data elements.

How Will You Dash?

A digital dashboard displaying various analytics charts and graphs. There is a line graph showing user engagement over time on the left, a section with total revenue marked as $74K, and bar charts illustrating user statistics by region. The central section highlights users in the last 30 minutes, focusing on different countries such as the United States, Canada, India, Pakistan, and Brazil.
A computer screen displaying analytics dashboards with various charts, including a line graph on the left and a cohort analysis table on the right. The table is populated with different shades of blue, indicating varying levels of user activity over several weeks. Text labels and numbers detail user retention statistics.
The image displays the dashboard of a motorcycle, including a set of analog gauges, a small digital screen, and multiple control buttons. The handlebars and mirrors are visible, with chrome detailing and a sleek, modern design.
A close-up view of the dashboard in a car, focusing on the analog dials. The dials have black backgrounds with orange and white indicators, showing various measurements. The lighting suggests a dimly lit or shadowed environment, highlighting the curvature and material texture of the dashboard.

Explore our app's features and user-friendly interface here!

Browser Tabs...

Workflow...

Project Management...

Special Interests...

This actor uses Dash-Rabbit to keep track of all the different services and websites associated with her growing career:

  • IMdB

  • Photographers

  • SAG & AFTRA Links

  • Make-up & Hair Stylists

  • Agent & Management Sites

  • Trade Publication Sites

  • Production Studios

Hobbies & Fun Stuff!

This actor uses Dash-Rabbit to keep track of all the different services and websites associated with her growing career:

  • Marketing

  • Venders

  • Supplies

  • BTB Connections

  • Linked-In

  • Communications

  • Google Business Links

Organized Efforts!

Structure the steps of your workflow and keep all your business links in one convenient place. Save time and daily effort:

  • Email Platform

  • Task Management

  • CRM

  • Marketing

  • Google Analytics

  • Google Sheets

  • Hostinger Developing

Greater Productivity!

No more losing needed tabs! Improve your browser efficiency and increase your speeds by closing out frequently used tabs. Organize your platforms with basic categories like:

  • Communications

  • Productivity

  • Development

  • Make-up & Hair Stylists

  • Agent & Management Sites

  • Or customize your own!

Space Saver!

This dashboard has transformed my workflow! I can access all my apps in one place, making my life so much easier. Highly recommend!

Terry J.

★★★★★

What a great idea! Dash-Rabbit is perfect, even for my specialized interests. At first I thought I wouldn't really use it - now, it's a life saver!

★★★★★

Alex P.

gray computer monitor

Get In Touch

Are you a Dash-Rabbit user?
Let us know how you use your Dashboard!